
Deduplicated from 97,000+ raw sightings across 15+ independent sources into one canonical record each.
// Service
Market Intelligence & Custom Lead Management
A custom-built system that scours the internet for every company in your target market — mapping their plants and locations, finding the decision-makers, building AI-researched company profiles, and scoring each one into Tiers A–D against your ideal customer. Then it manages those leads all the way to the call.
Beyond the Lead List: A Living Map of Your Entire Market
Every B2B team works from some picture of its market — usually a purchased list, a shared sales database, or a spreadsheet built by hand over years. All three fail the same way: they're incomplete, they're organized by legal entity instead of buying reality, they know nothing about facilities or plants, and they start rotting the day they're made.
ThinkGenius builds the alternative: a custom market intelligence platform that treats your entire target market as one living dataset. It discovers every company from scattered public sources, untangles who owns what, maps every plant on the ground, finds the people who sign purchase orders, and scores everything against your ideal customer profile — in Tiers A through D, on your criteria, in a system built around you and nobody else. It can even benchmark its own coverage against official establishment counts, so you know what share of your market you've actually mapped — not just how many rows you have.
The screenshots on this page come from a live production deployment built for an equipment manufacturer selling into the commercial baking industry — the full build is documented in the Breadcrumb case study. The same architecture adapts to any industry or vertical.
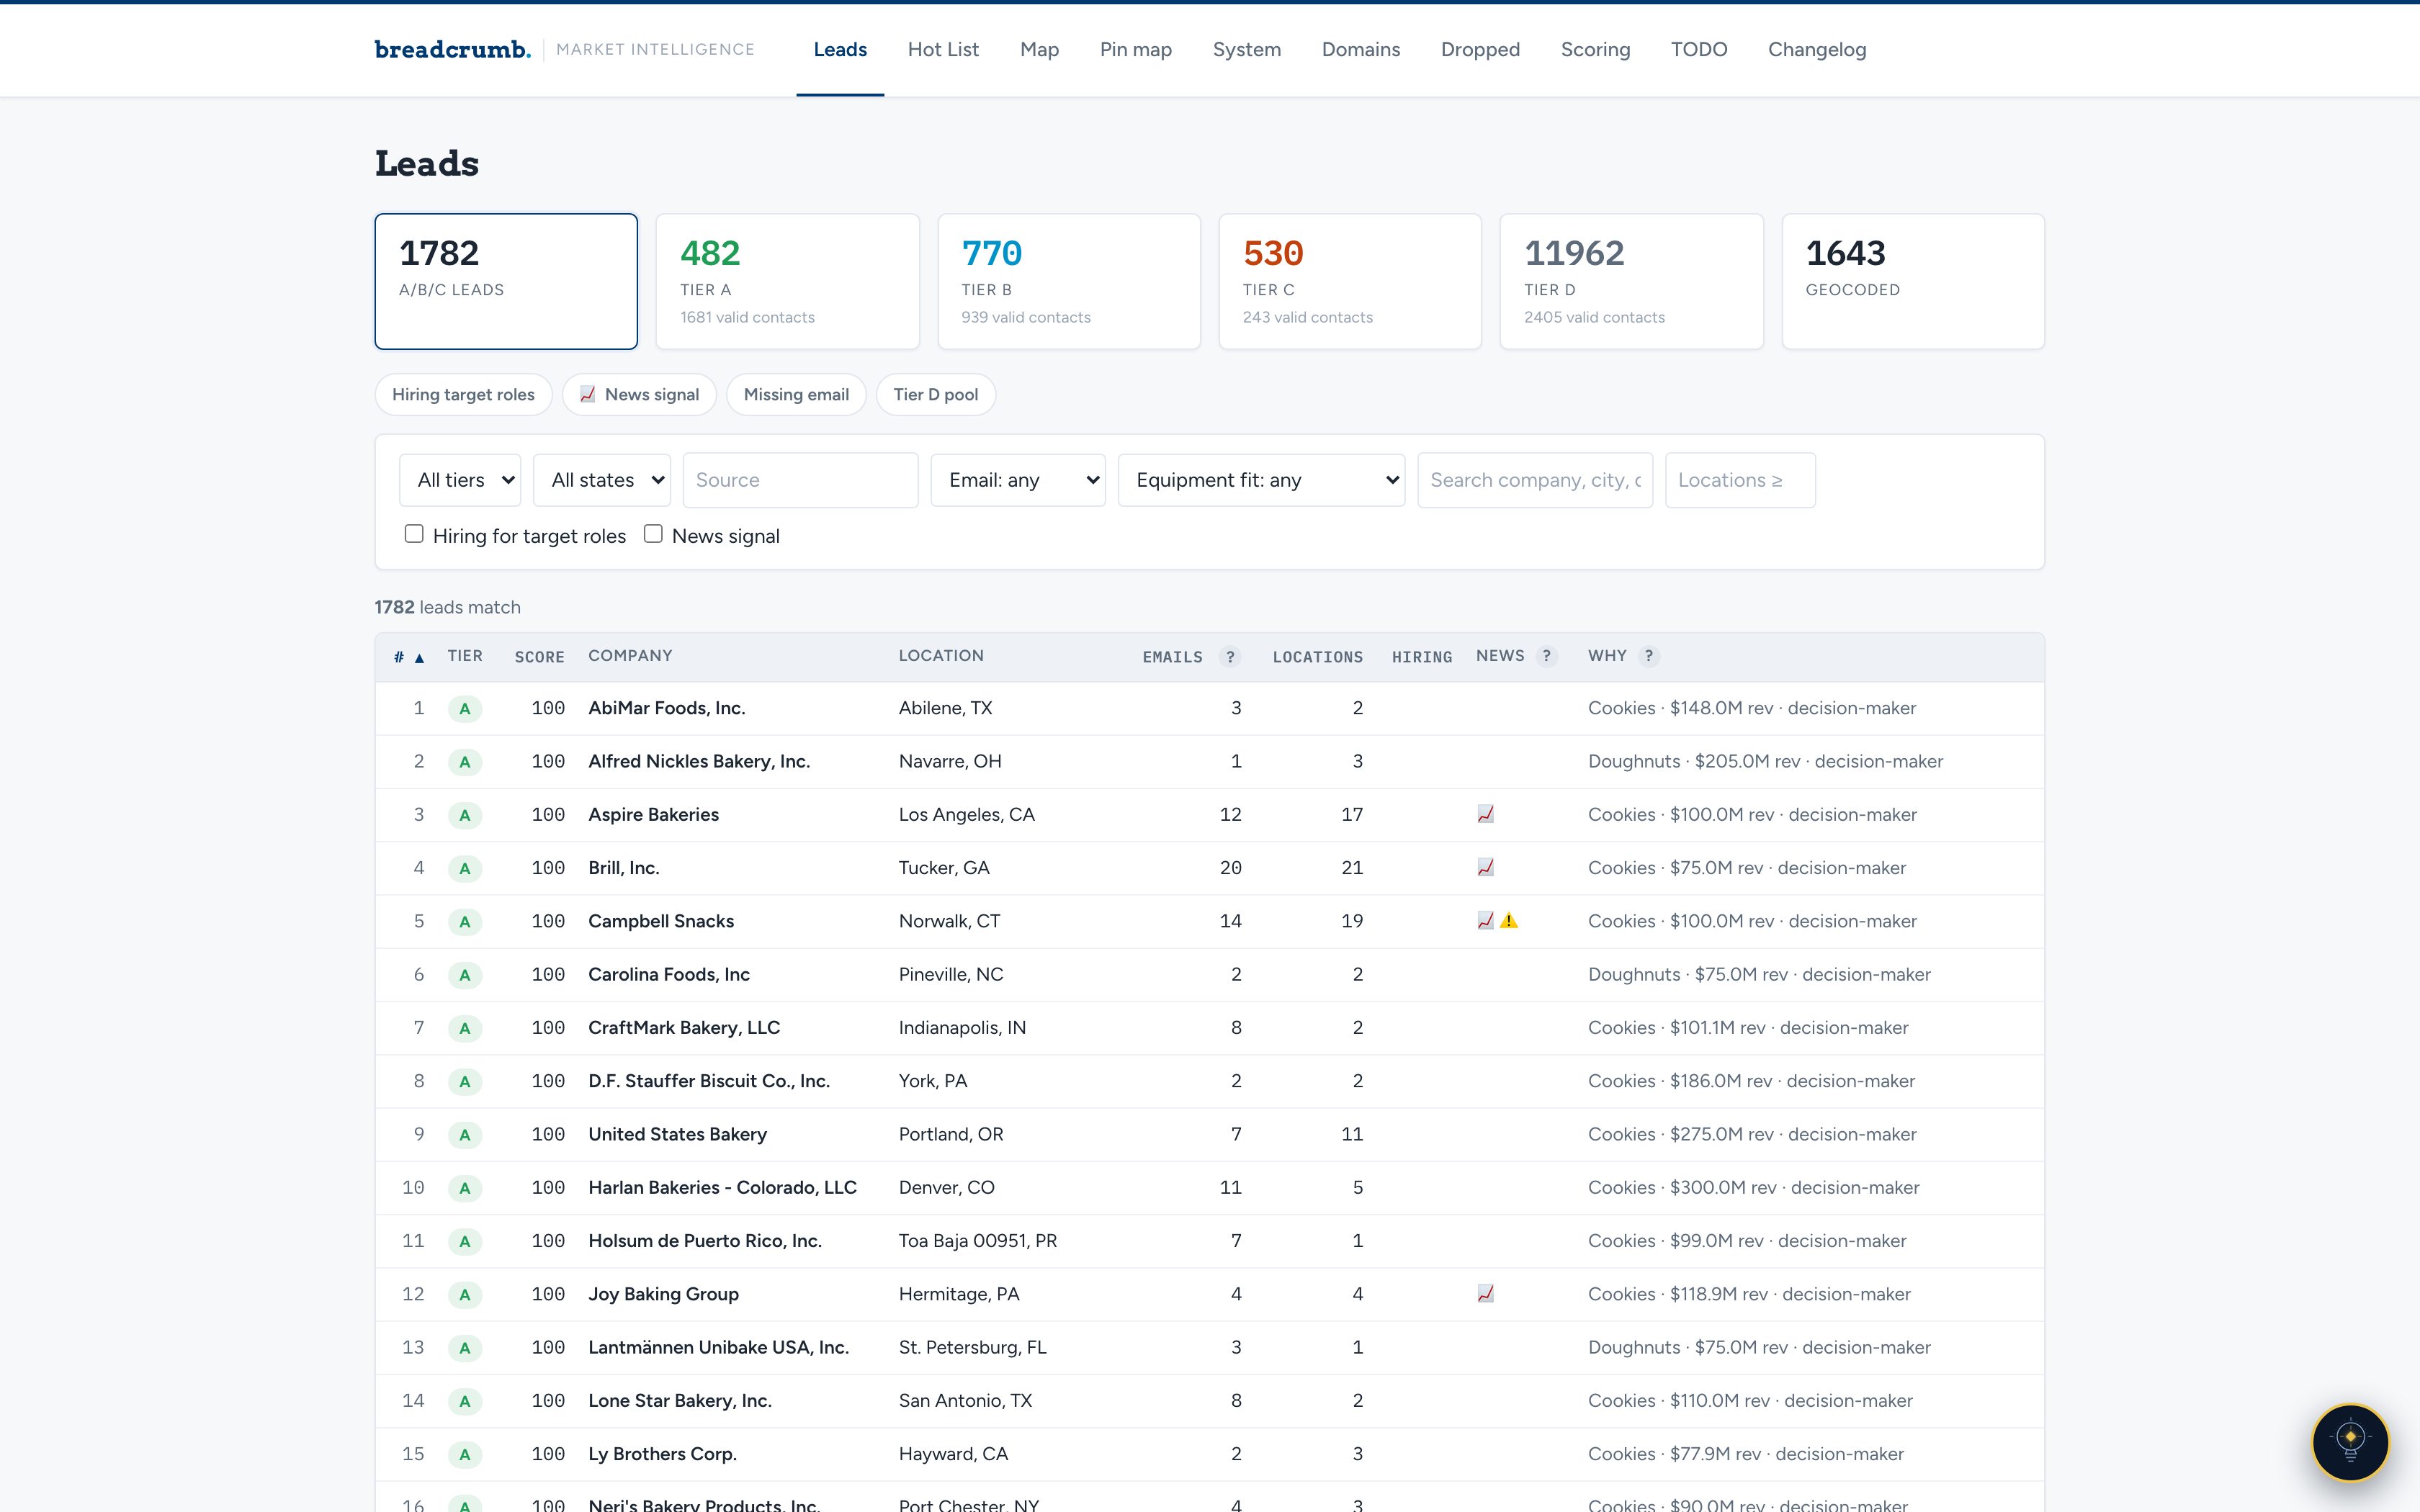
Scored 0–100 and tiered against the client's ideal customer profile — with the reason behind every score.
Decision-makers and staff with titles, seniority, and departments — 5,600+ with verified email addresses.
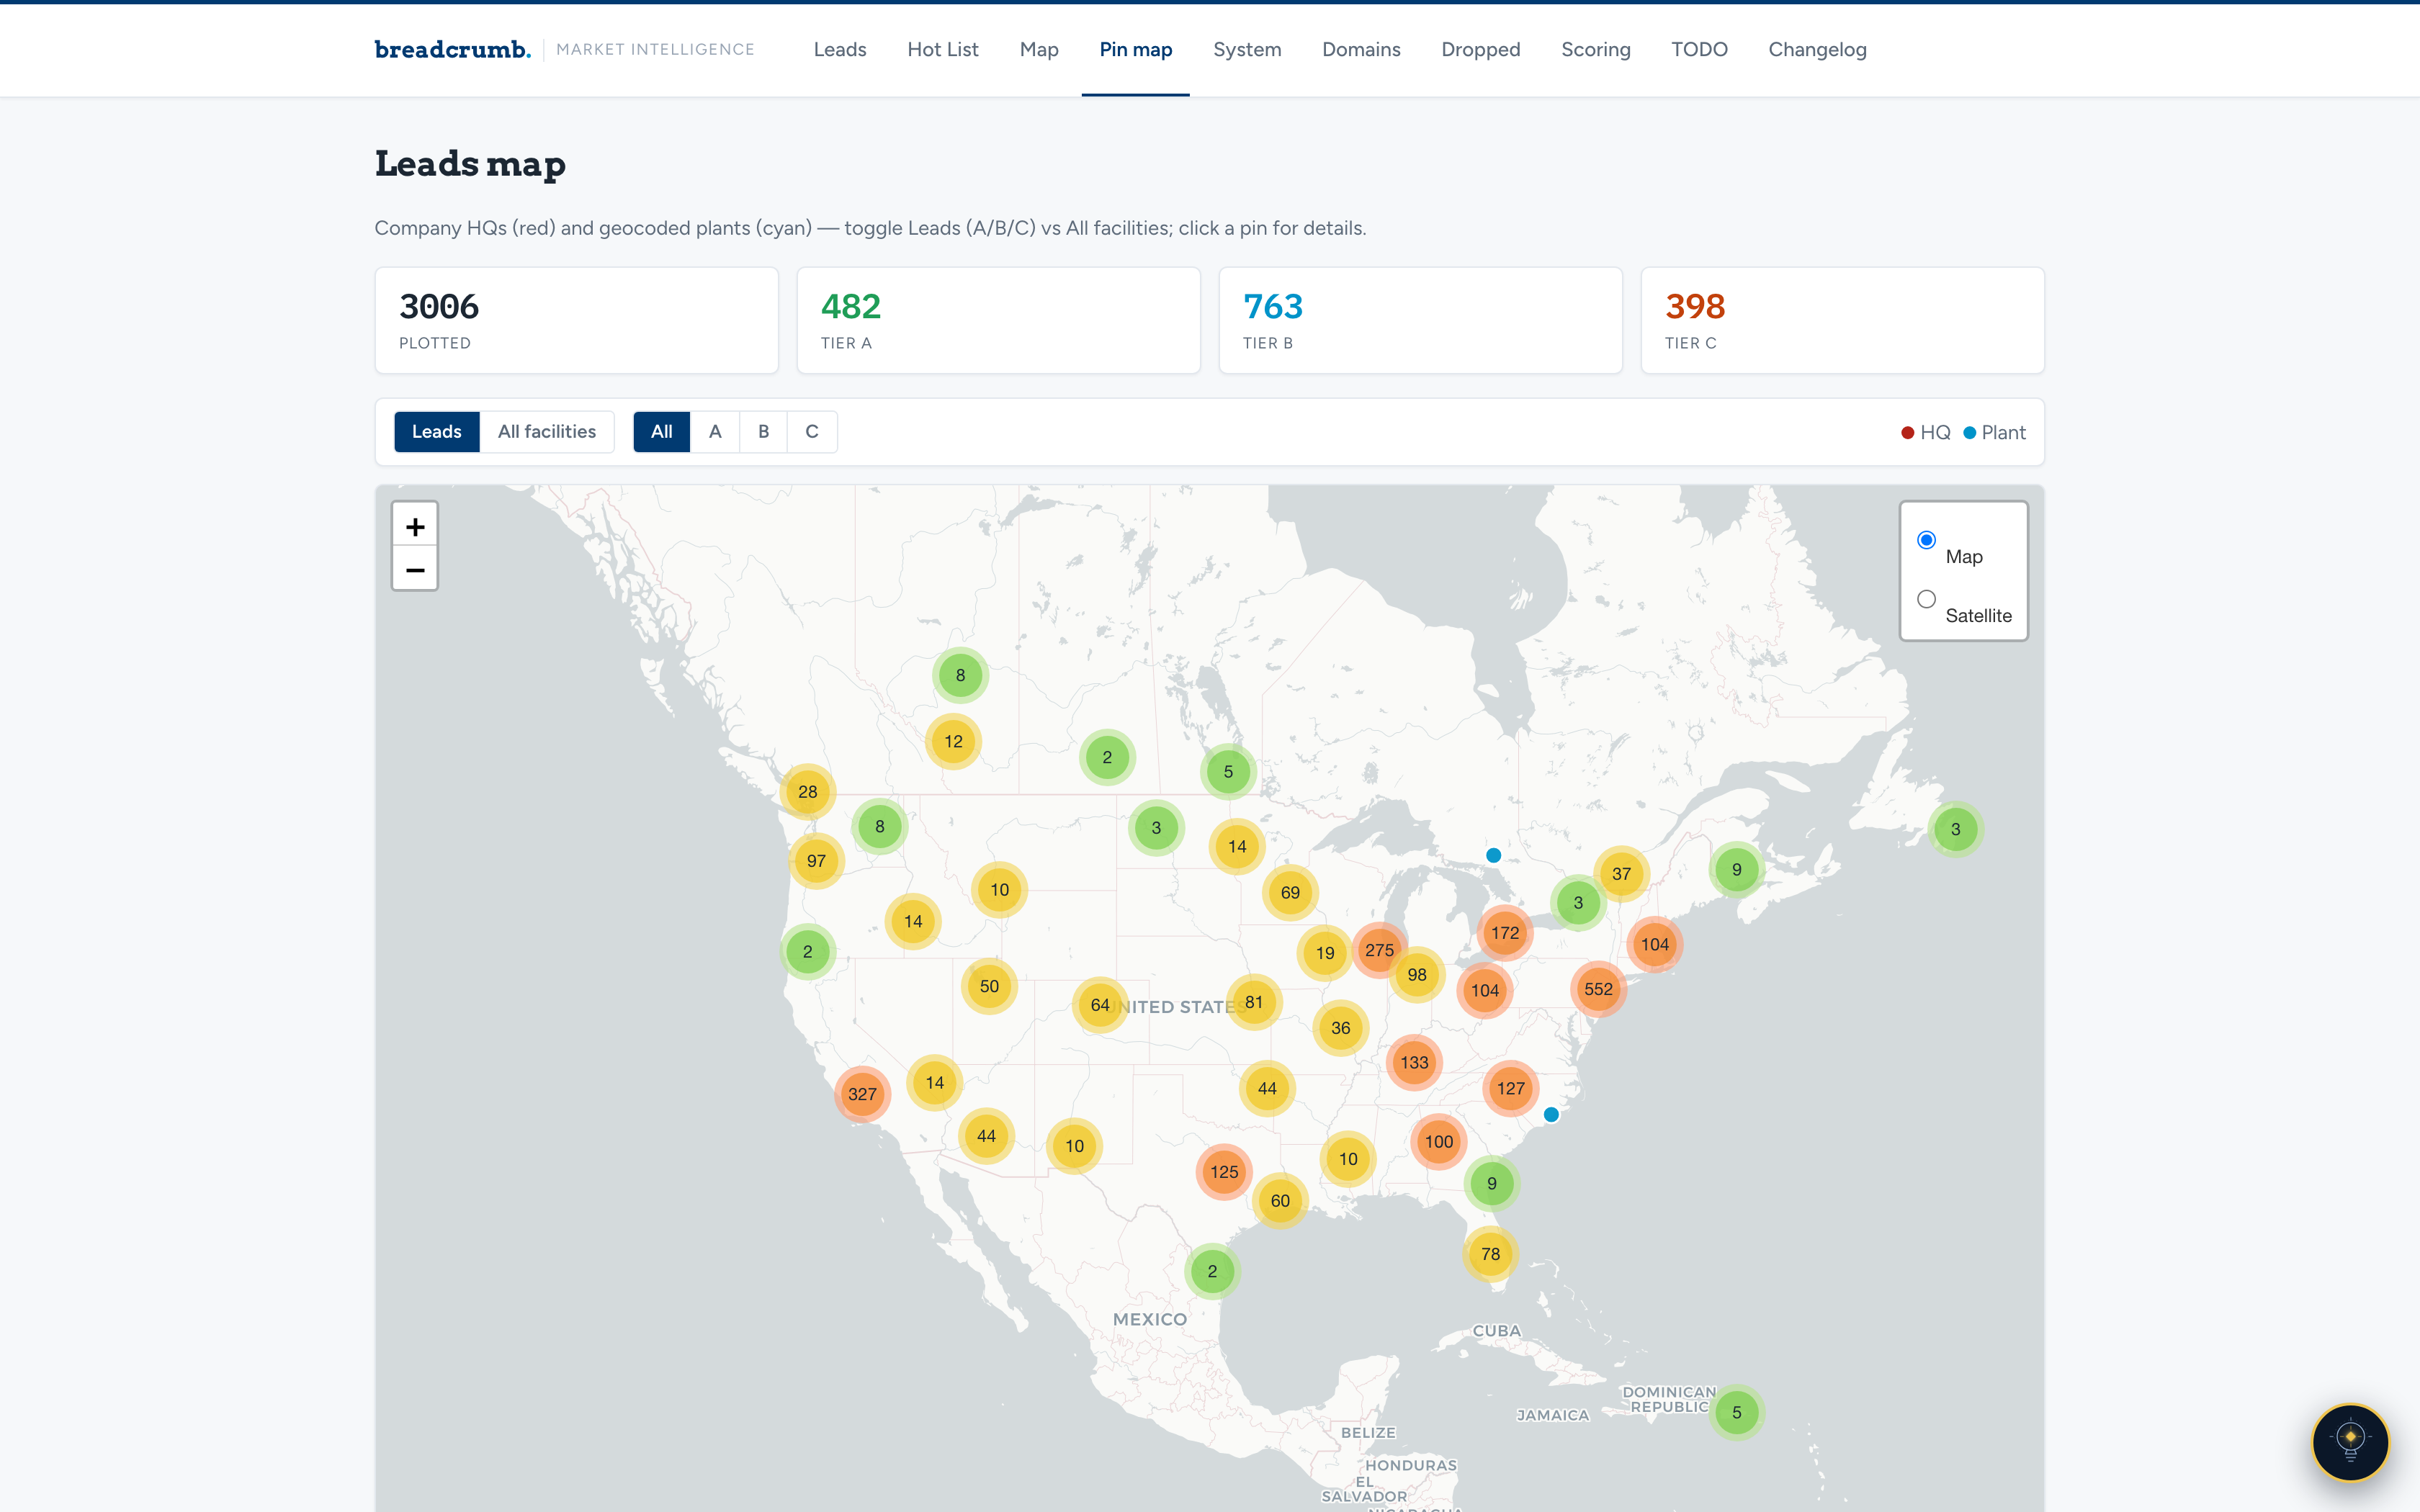
Plants and headquarters geocoded and footprint-measured as a proxy for production capacity.
What the Platform Does
Six subsystems feeding one clean database — each one automated, each one auditable.
Discovery
Scour the Internet for Your Market
Industry directories, trade publications (including print editions read by OCR), public registries, map data, tradeshow exhibitor lists, and web sweeps — multiple independent nets, because no single source sees a whole industry. Your existing CRM imports too, so known customers and dead ends are excluded from day one.
Clean Data
One Record Per Real Company
Raw sightings are deduplicated into canonical company records without destroying evidence — every source a company was ever seen in stays attached. Subsidiaries, brand names, and rebrands get resolved instead of counted twice.
Profiles
AI-Researched Company Dossiers
An AI research pass reads each company's public footprint and writes a structured profile — products, revenue, plants, ownership, fit analysis, buying signals — with every claim backed by stored source URLs a human can audit in seconds.
Locations
Plants & Facilities on the Map
Every headquarters, plant, and distribution center geocoded and plotted on interactive and satellite maps, with building footprints measured for estimated square footage — a direct proxy for capacity and budget.
People
Verified Decision-Makers
The roles that match your sales motion — plant managers, operations VPs, engineering directors, owners — found and verified, but only for companies that score into qualified tiers, so no effort is wasted on companies you'd never call.
Scoring
Custom Tiers A–D
A 0–100 scoring model built around your ideal customer profile ranks every company into Tiers A through D. Weights, thresholds, and criteria are yours — and every score is explainable, audited, and re-computed as the market moves.
Custom Lead Scoring: Every Company Tiered A Through D
Generic lead scores answer someone else's question. A custom scoring model encodes your definition of a great customer and applies it to every company in the market, every time the data changes. Scores are composed from weighted dimensions tuned per client:
- Product or service fit — does what they do match what you sell? The AI reads each company and maps your offering to their specific operations, line by line.
- Company size — revenue estimates, headcount, and number of locations, each with a recorded source.
- Facility scale — measured building square footage as a physical proxy for capacity and spend.
- Contactability — does the record hold a verified decision-maker, or just an info@ address?
- Momentum — hiring for the roles that signal investment, and news classified as growth or risk.
- Geography — territory and region weighting that mirrors how your team actually covers the map.
- Data confidence — how many independent sources corroborate the record.
The output is four tiers with plain meanings: Tier A — ideal fit, sales-ready, verified contact in hand. Tier B — strong fit, worth contact work. Tier C — possible fit or smaller opportunity. Tier D — the tracked pool, watched for the signal that promotes it. Every score keeps a history, supports a manual override when a human knows better, and shows its "why" right in the lead table — so reps trust the ranking instead of second-guessing it.
Company Profiles an Analyst Would Sign
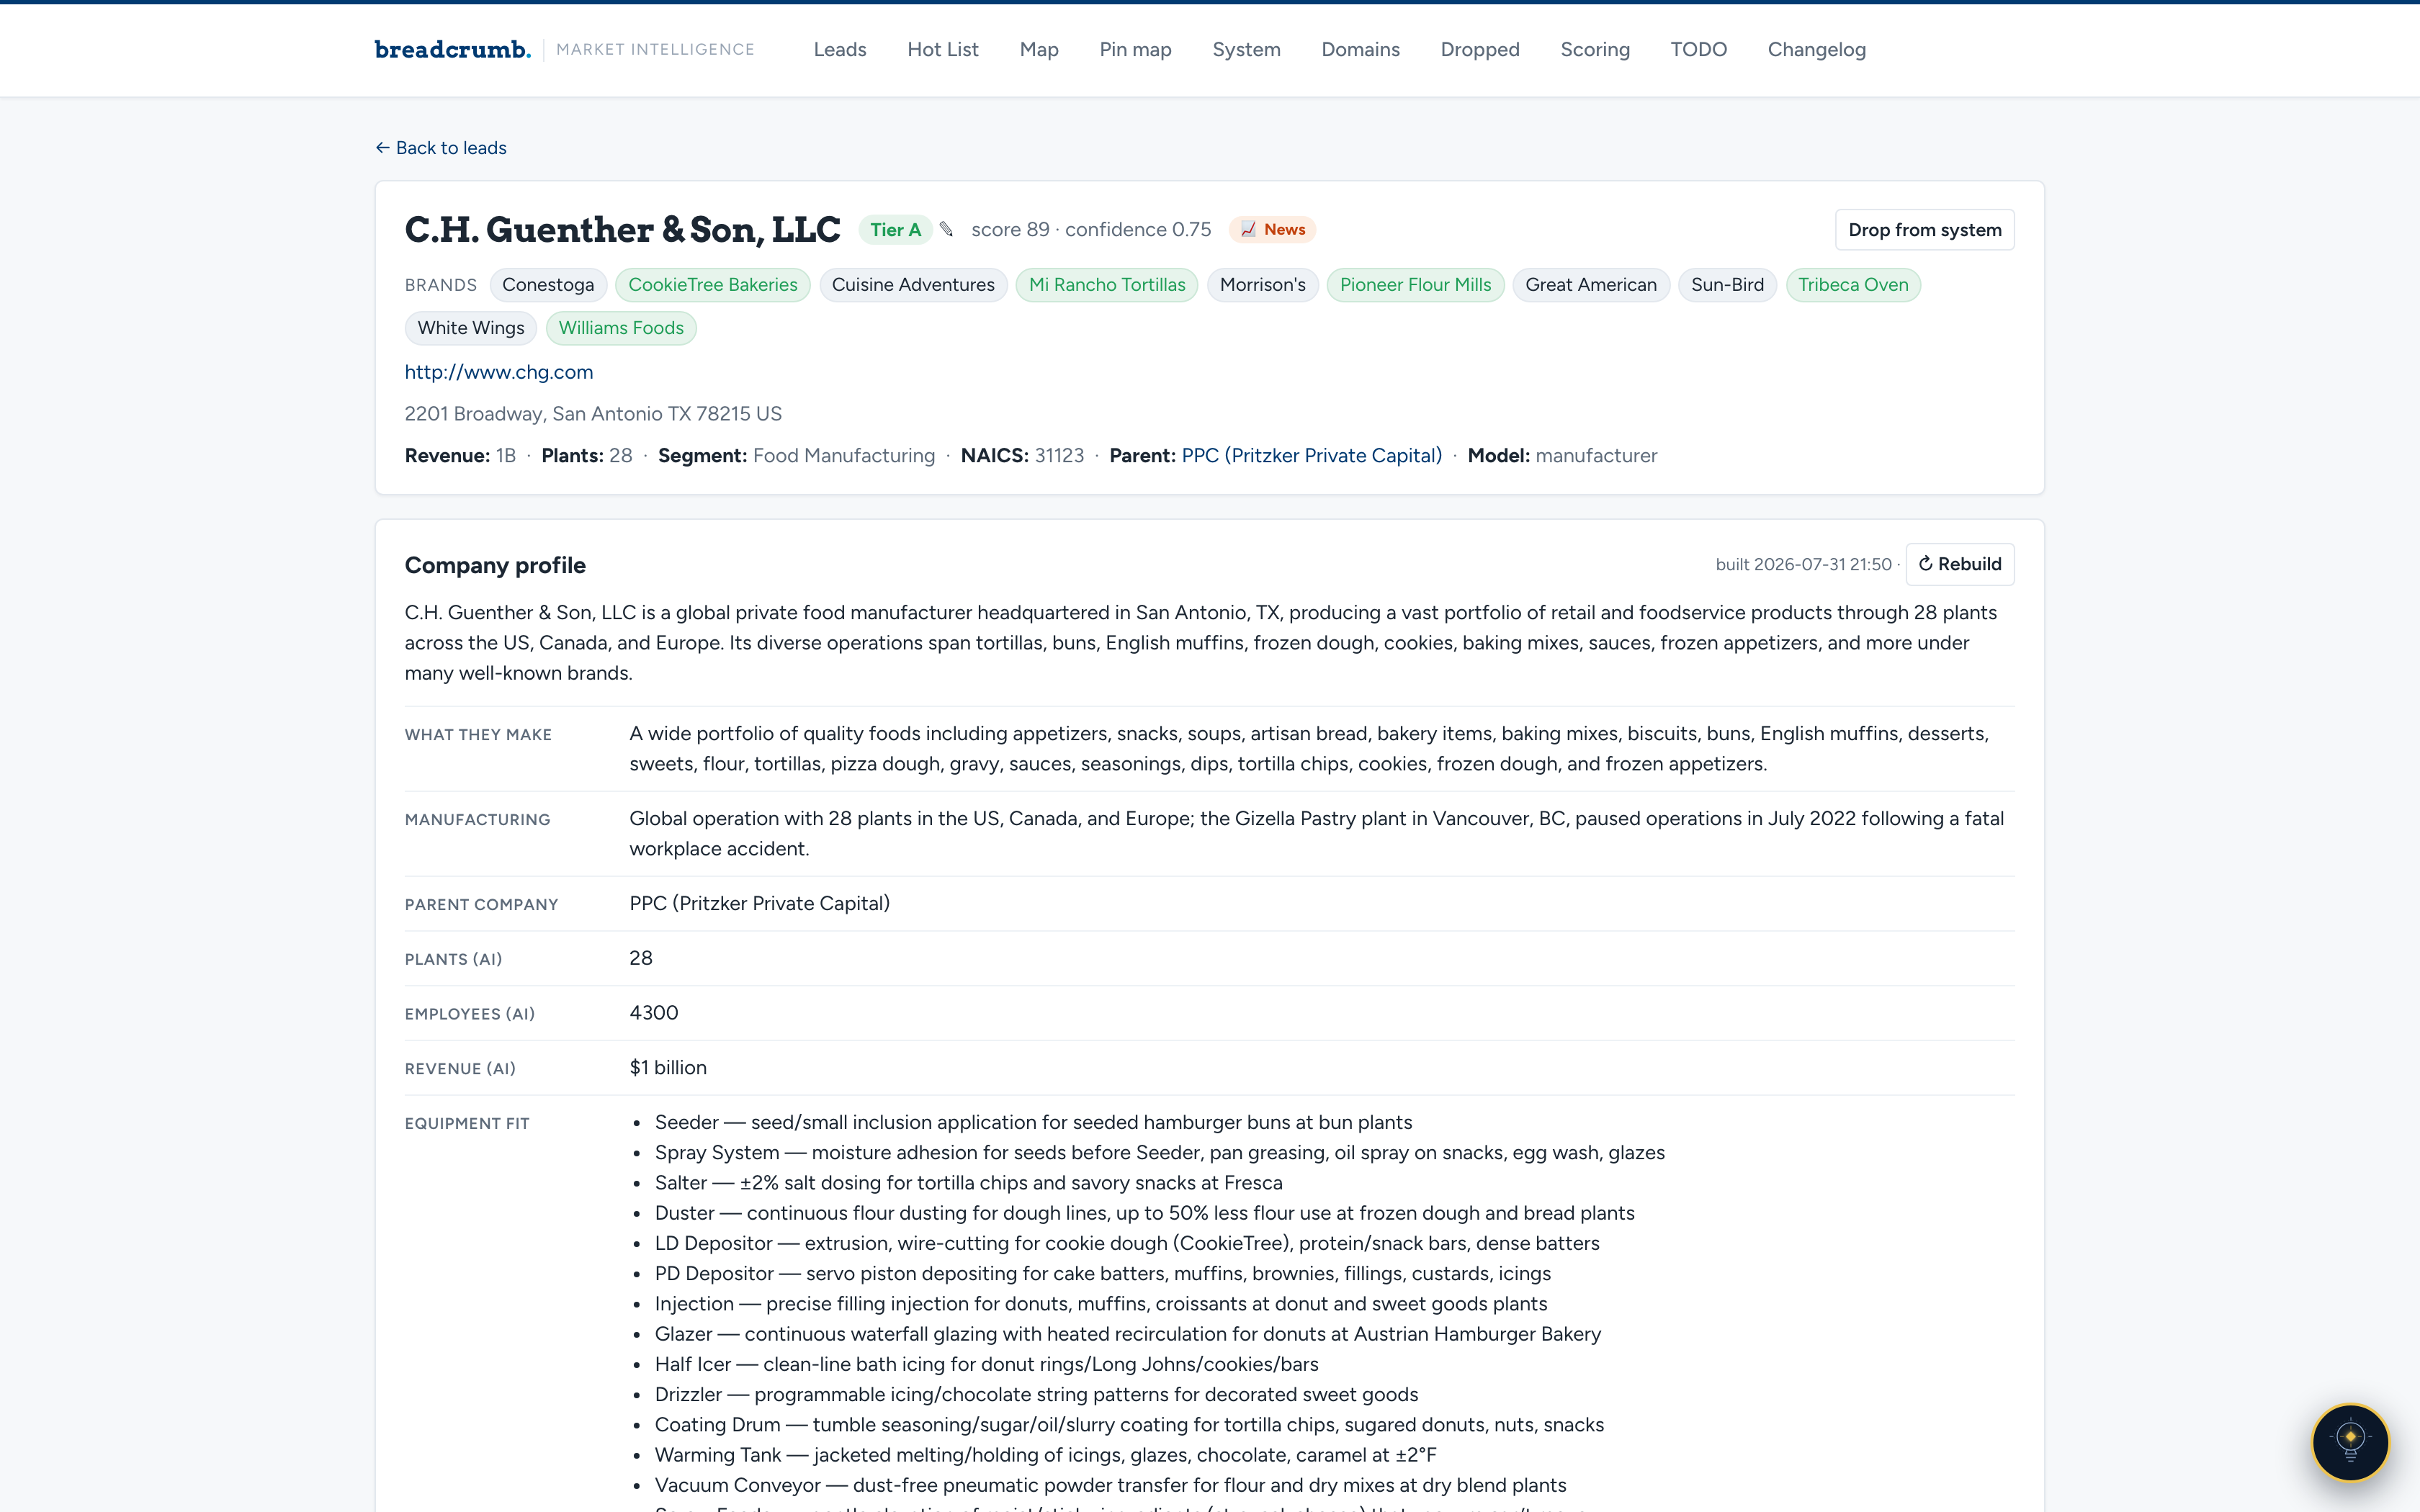
Each company gets a dossier that reads like a researcher spent a day on it: what they make, where they manufacture, who owns them, estimated revenue and headcount, and a line-item analysis of how your products map to their operations.
Grounded in Facts: How AI Hallucinations Get Engineered Out
The biggest risk with AI-generated research is confident nonsense. This platform is engineered specifically against it: the AI is never allowed to simply say things. Every claim it produces — revenue, plant count, ownership, buying signals — must be drawn from real pages the system actually fetched, and every profile stores the exact source URLs behind each fact. When a profile says a company runs 28 plants under a private-capital parent, each of those facts links back to where it was found. If a claim can't be supported by a source, it doesn't ship.
- Reliable sources first — the company's own website, public filings and registries, and established trade publications are weighed ahead of random web hits.
- Cited sources on every claim — each profile keeps a per-fact source map, so any statement can be traced to the page it came from and audited in seconds.
- Independent corroboration — facts are cross-referenced across sources, counted by distinct publishers, so two copies of the same press release never count as two confirmations.
- Citations re-verified — a separate adversarial pass re-reads cited sources and checks that they actually say what the profile claims; citations that don't hold up are dropped.
- Contradiction audits — cross-source consistency checks flag conflicting facts, implausible values, and stale records for human review instead of letting them stand.
- Humans approve the risky parts — ambiguous company matches are quarantined for review and duplicate merges are only ever suggested, never automatic.
The result is AI speed with analyst-grade trust: a dataset your team can act on without wondering which parts the machine made up.
Corporate Structure, Broken Down Entity by Entity
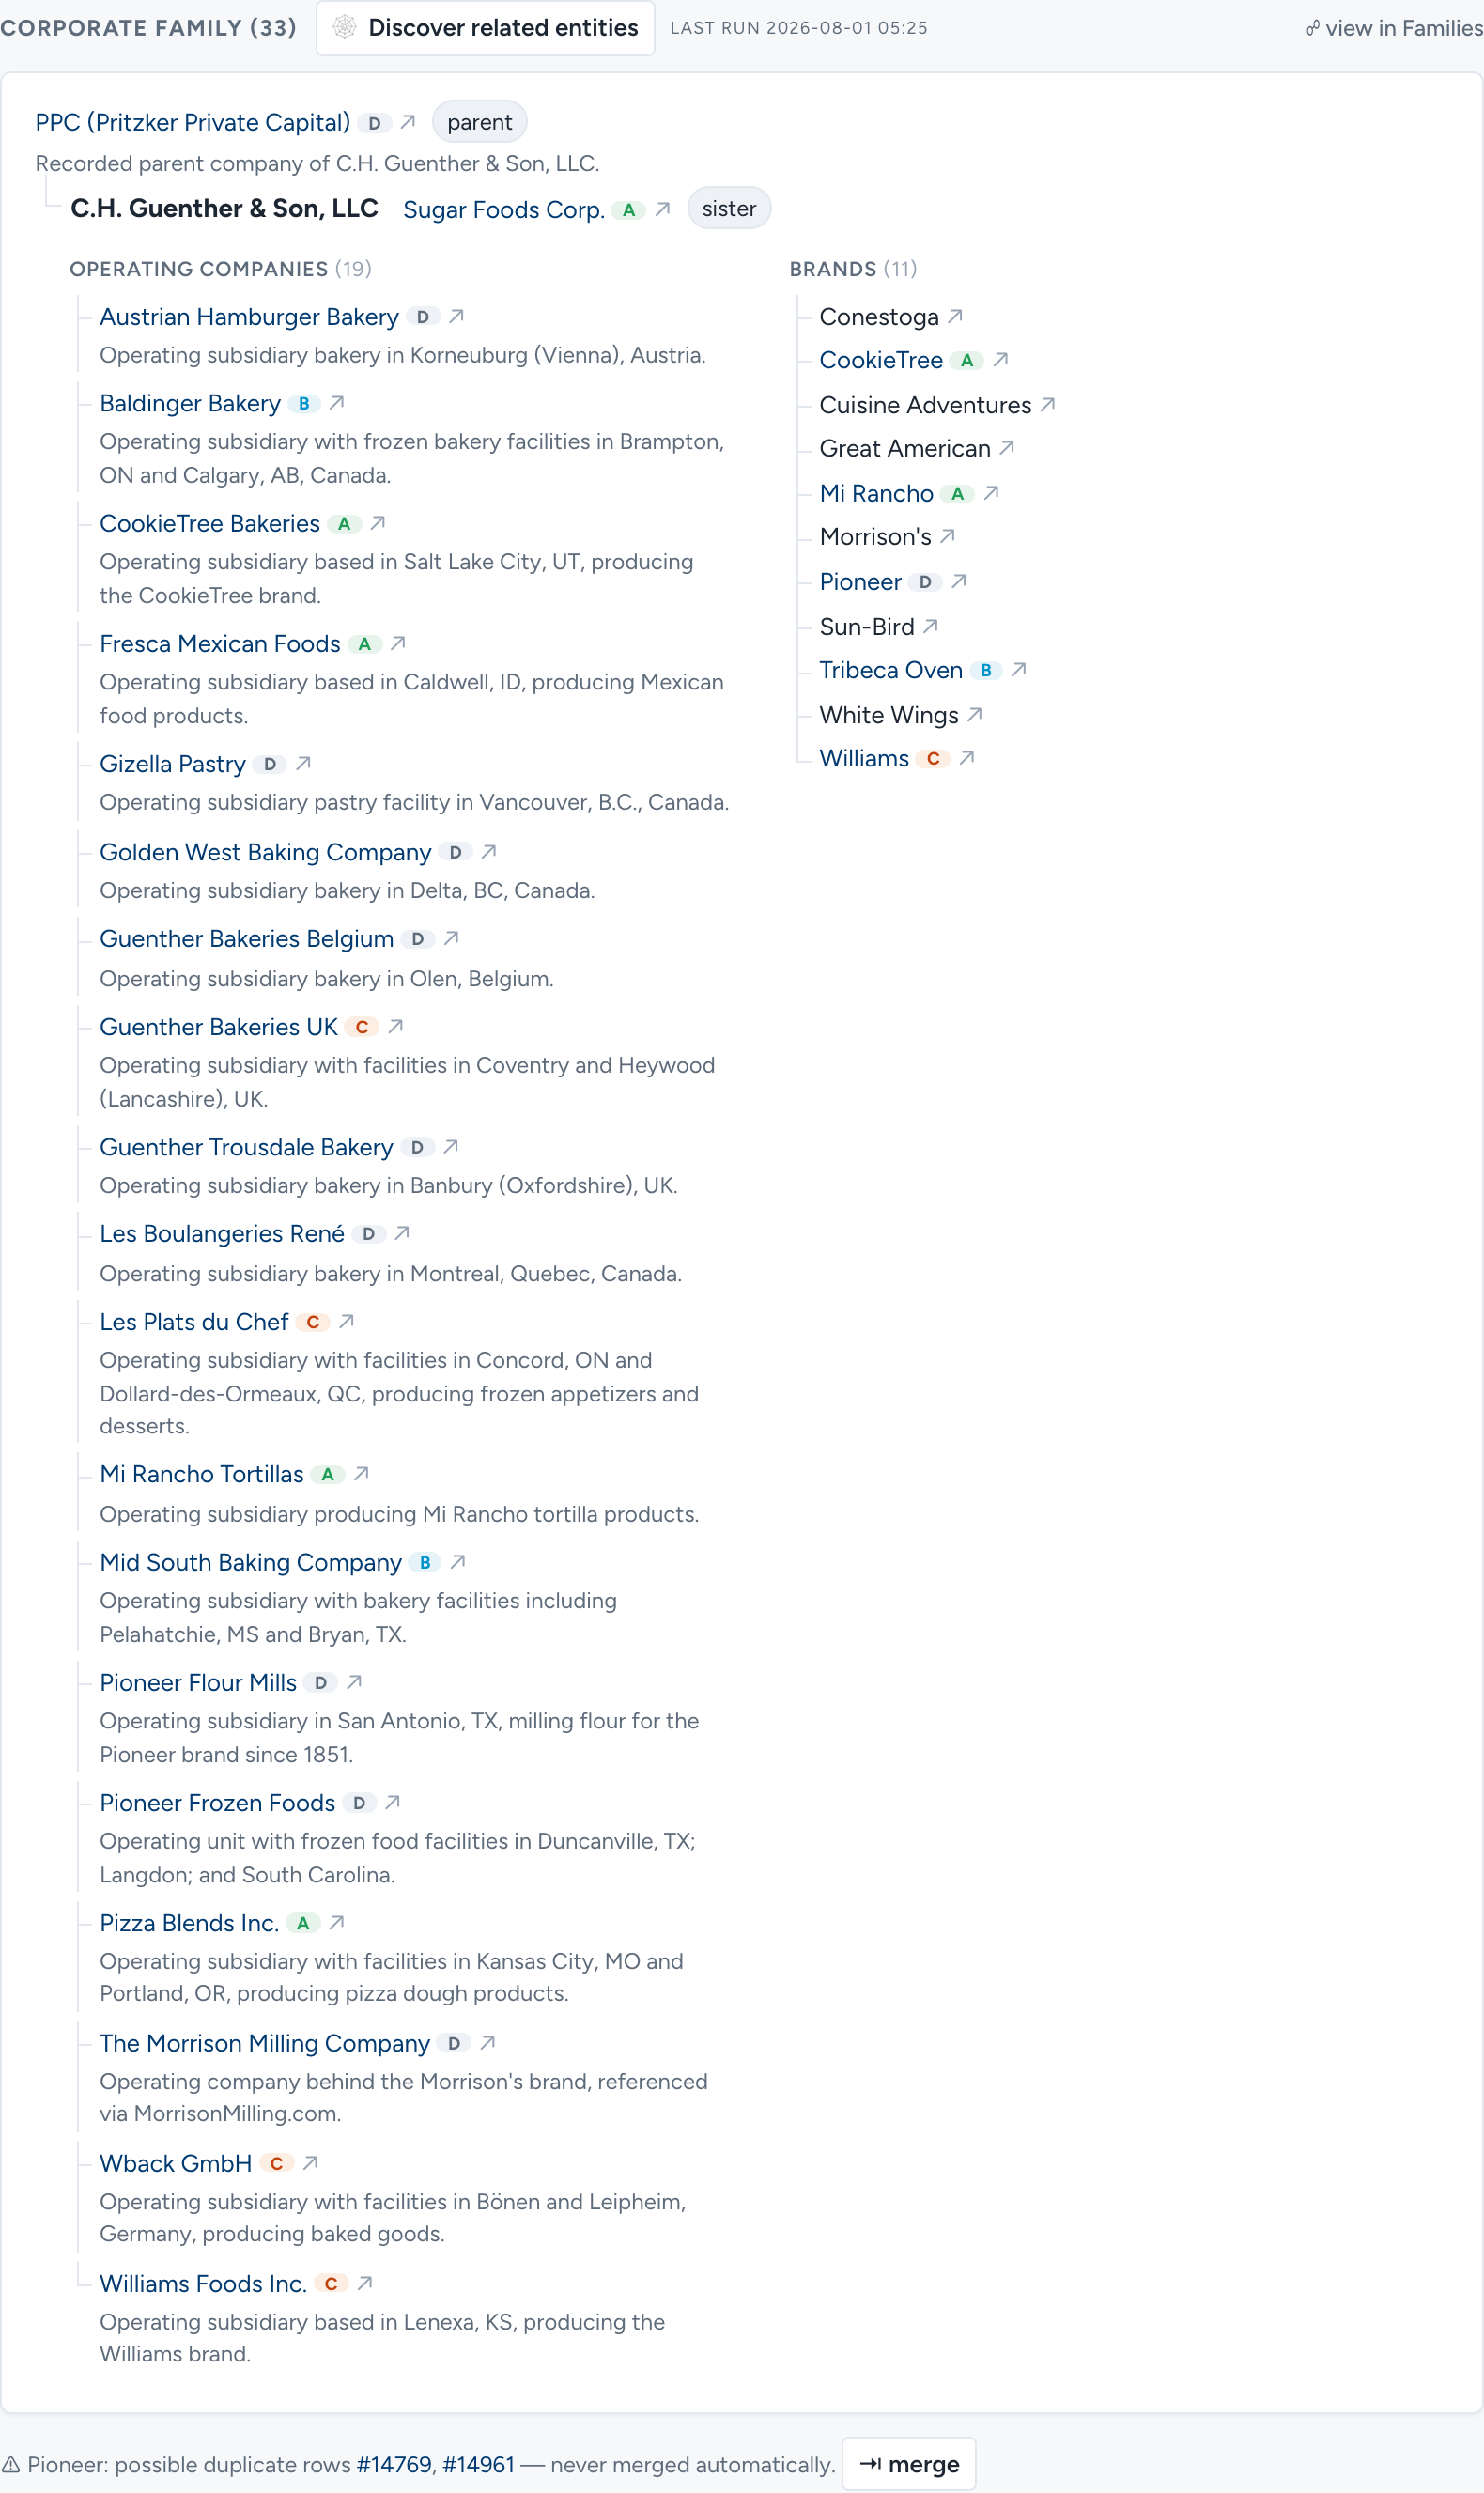
B2B markets are full of camouflage: one buyer operating behind a private-capital parent, a sister company, nineteen operating subsidiaries, and eleven brand names. The platform untangles the whole family — parents, sisters, operating companies, brands, historic names, and acquisitions — and draws it as one tree, with cited evidence behind every relationship. Every relative that's held as its own lead carries its tier badge right in the tree, so the family view doubles as a portfolio map: one glance shows which corners of a conglomerate are already scored, worked, or untouched.
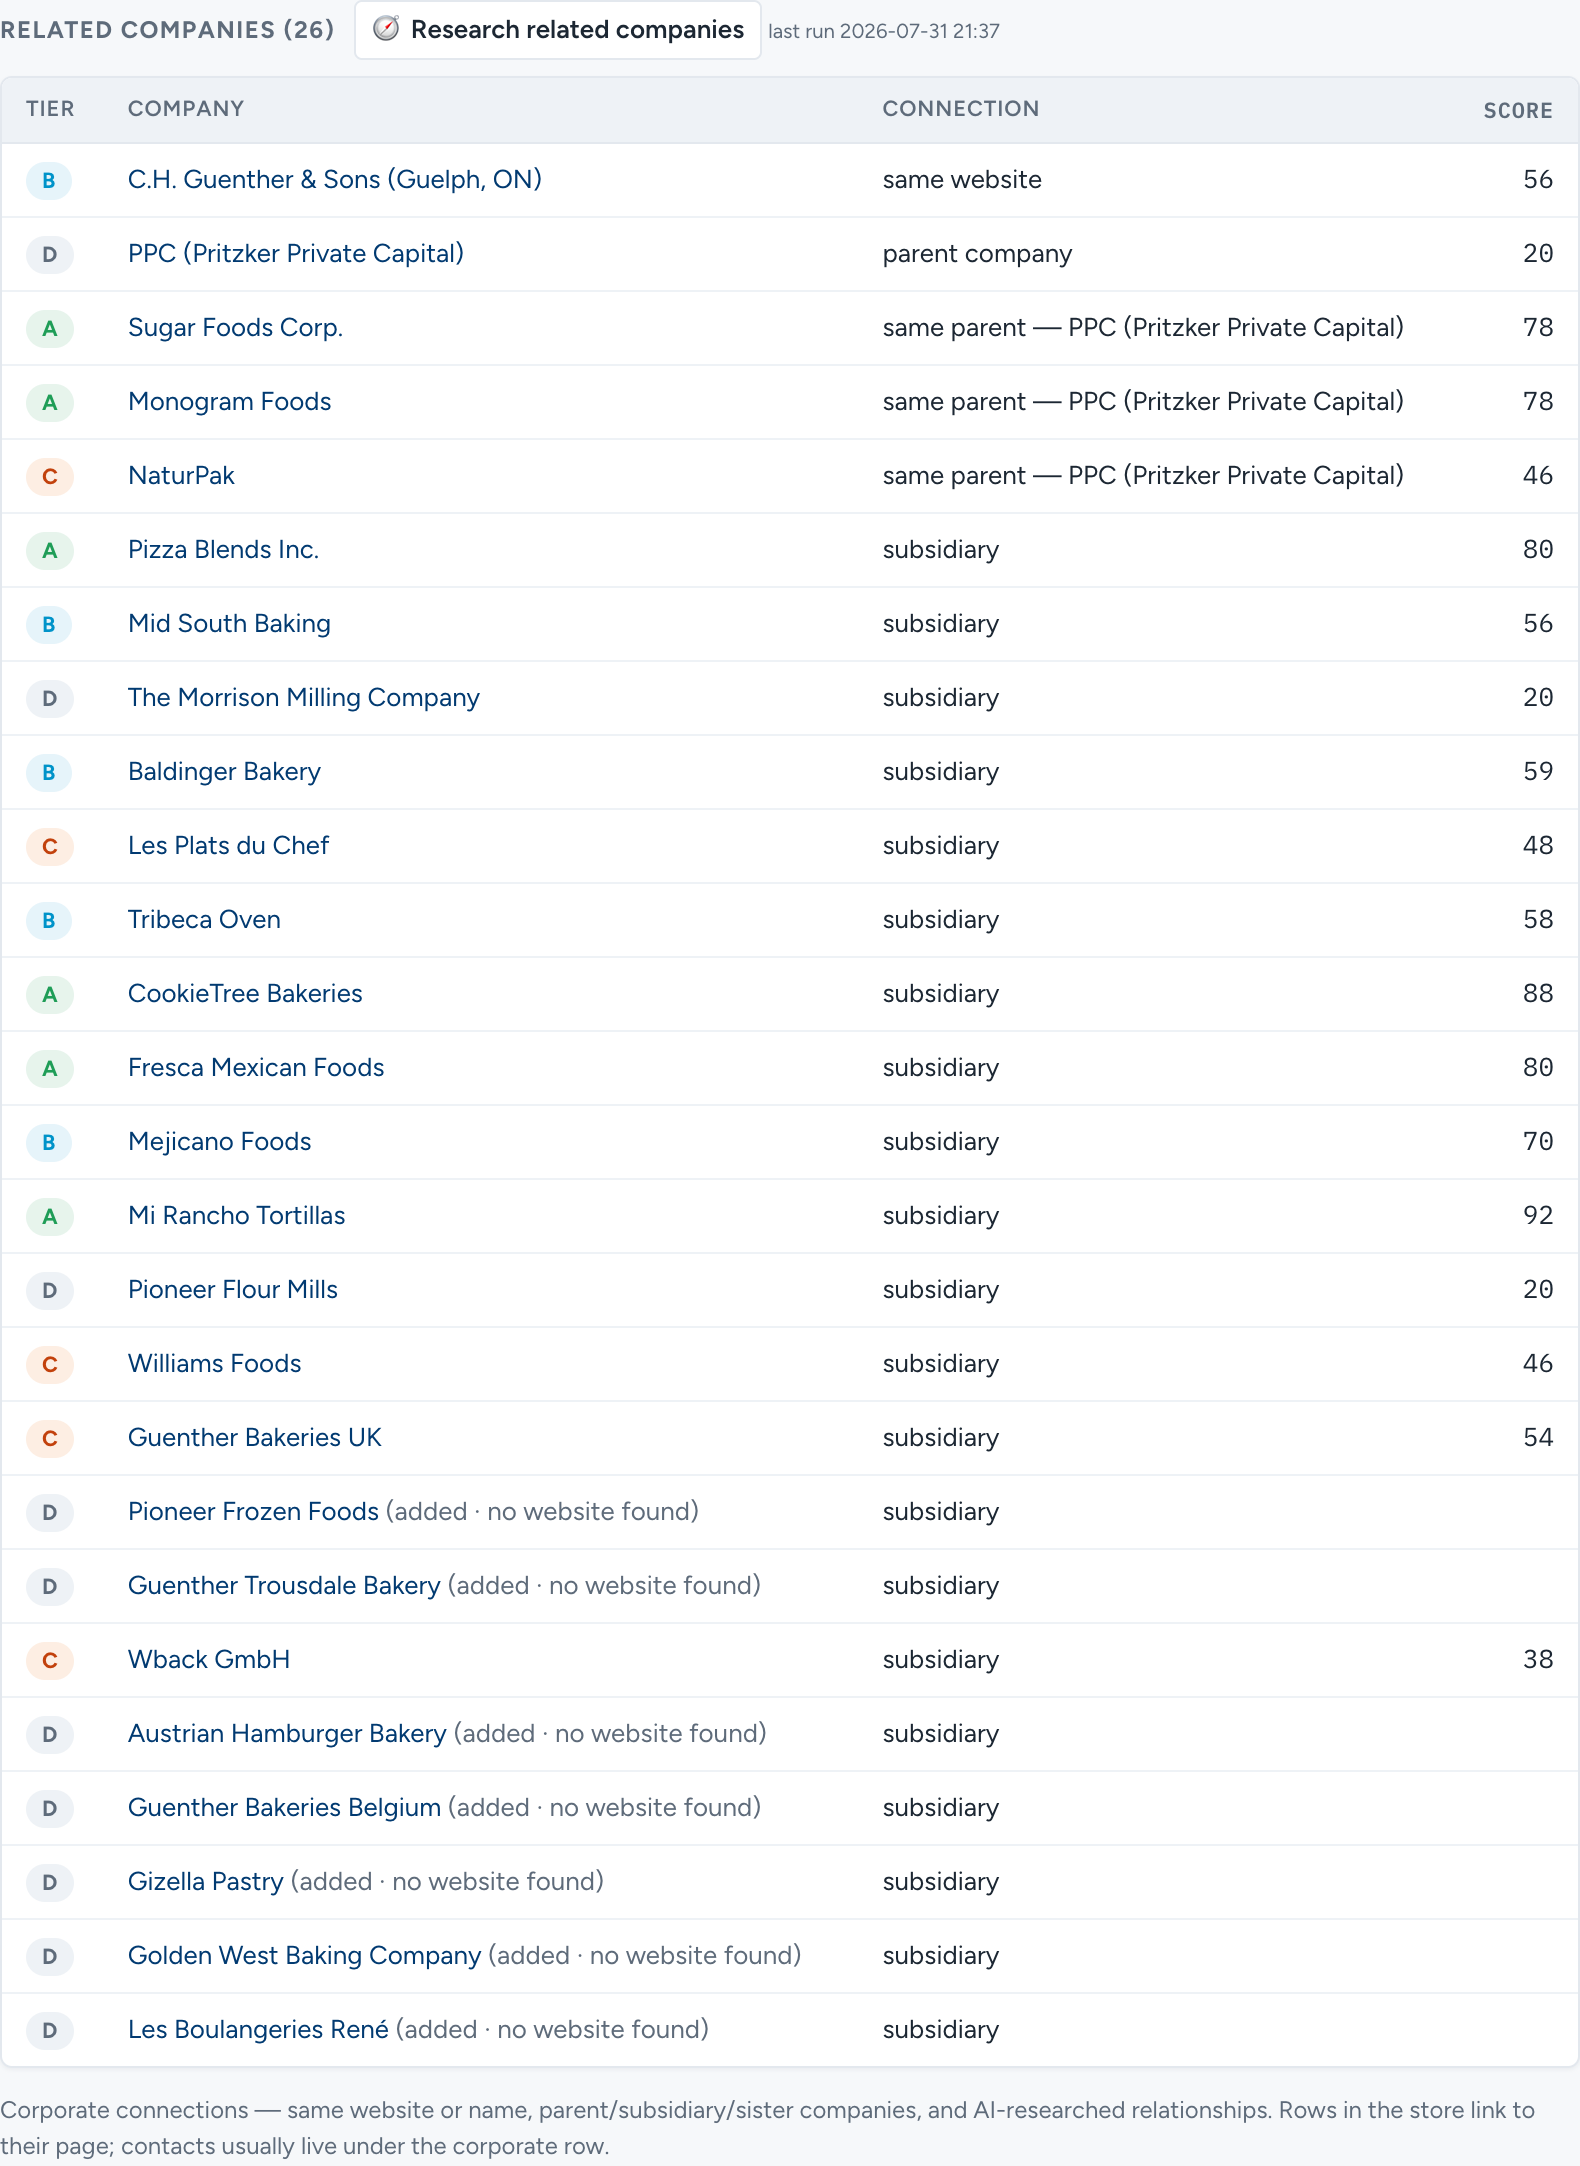
Alongside the tree, a related-companies view cross-references every connection — same website, parent company, sister under the same owner, subsidiary — against the rest of the database, each row carrying its own tier and score. Relatives that aren't in the system yet can be added and researched in one click, so one good company routinely unlocks a dozen more. And when the same entity shows up twice across sources, a merge is suggested, never automatic — a human approves every collapse, and the losing record's evidence moves to the survivor instead of being thrown away.
Plants, Locations, and the Market on a Map
For anyone selling equipment, services, or supplies into physical operations, the facility is the opportunity — and facilities are exactly what lead lists don't have. The platform researches locations down to the building: every plant geocoded, plotted on clustered interactive and satellite maps, footprint-measured for estimated square footage, and given its own per-facility fit score. Territory planning becomes one look at where the density is.
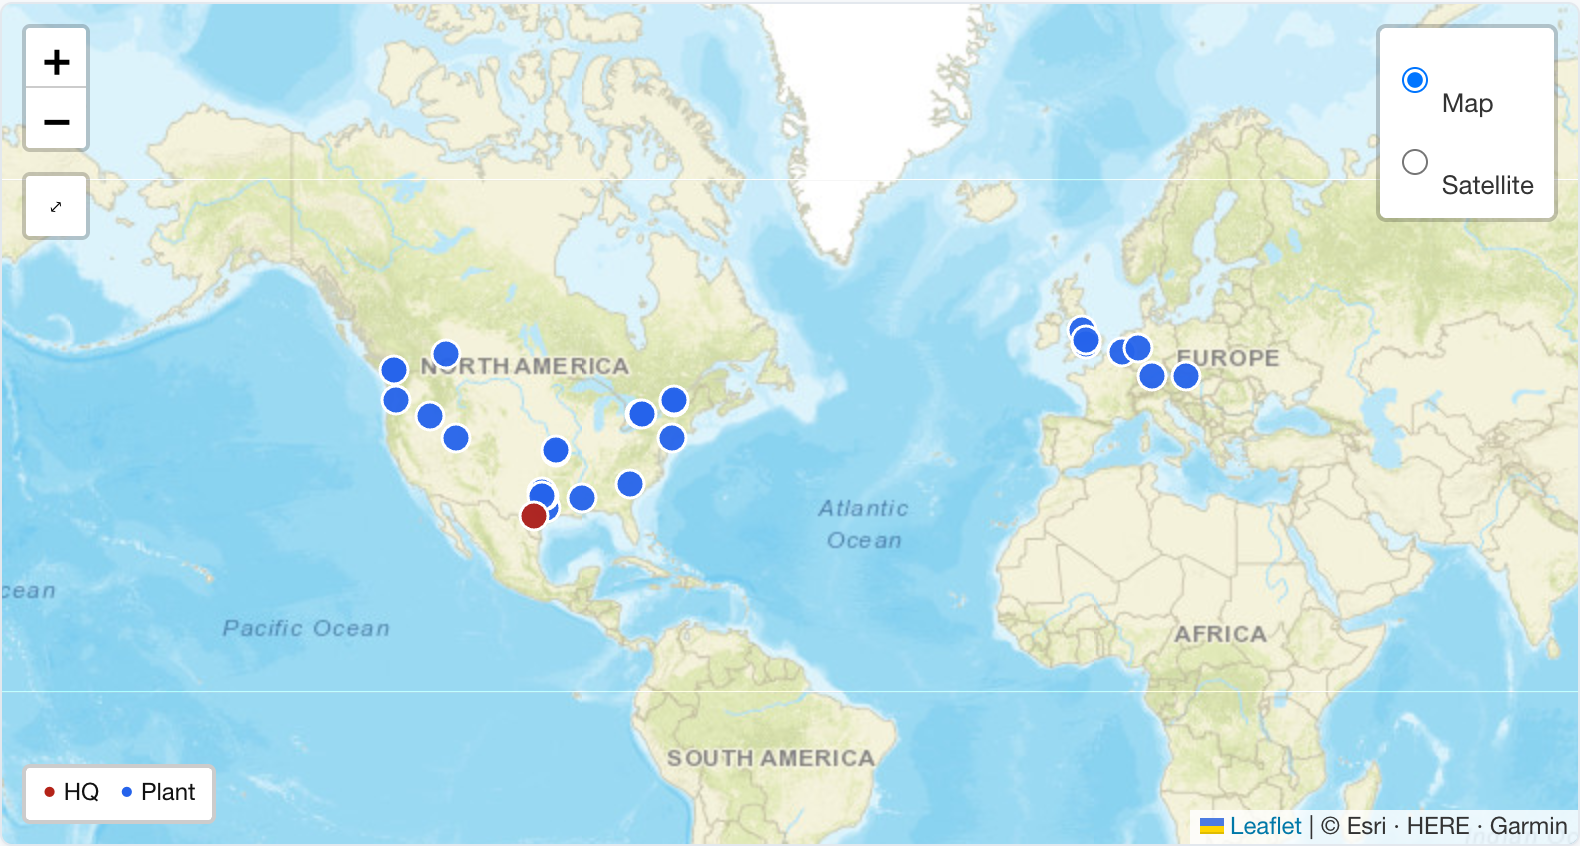
The same mapping continues inside each company. Every plant or business location a company operates — including facilities running under subsidiary names — is plotted on its own per-company map, headquarters and plants distinguished, with a satellite view that goes down to the individual building.
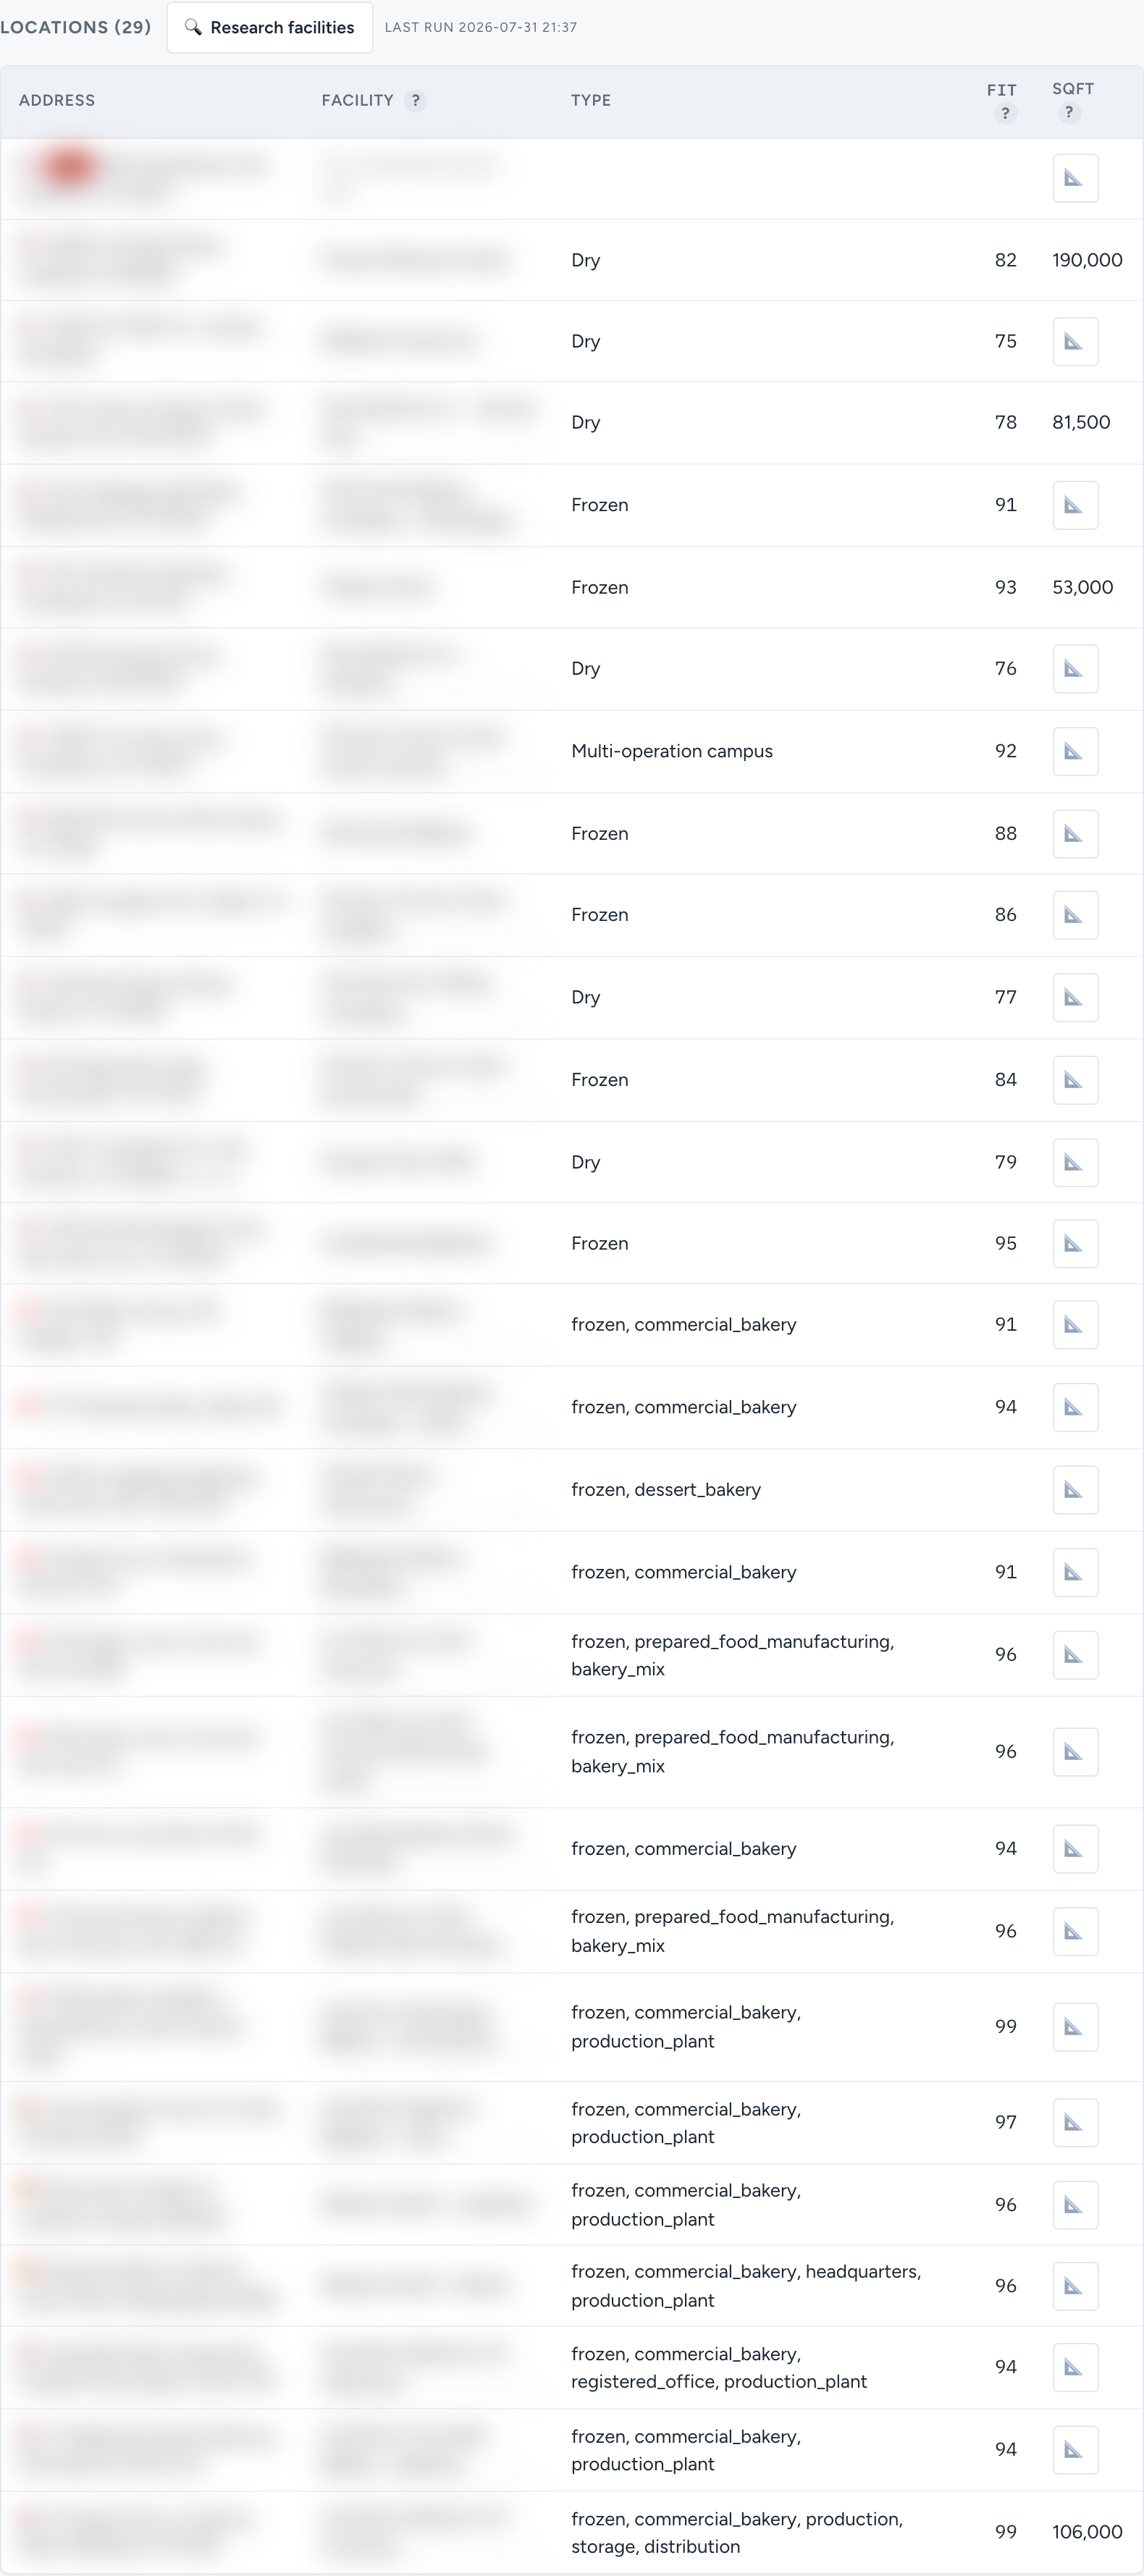
Each location then gets a profile of its own: what that specific facility manufactures — frozen or dry production, commercial bakery lines, prepared foods, storage and distribution — along with its estimated square footage and a per-facility fit score against your offering. And because deals happen at the plant level, contact discovery attaches the right people to those locations: plant managers, operations leaders, and engineering directors with validated email addresses, LinkedIn profiles, and phone numbers where available — so your team reaches the decision-maker for that facility instead of a generic corporate inbox.
Lead Management Built In — From Signal to Call
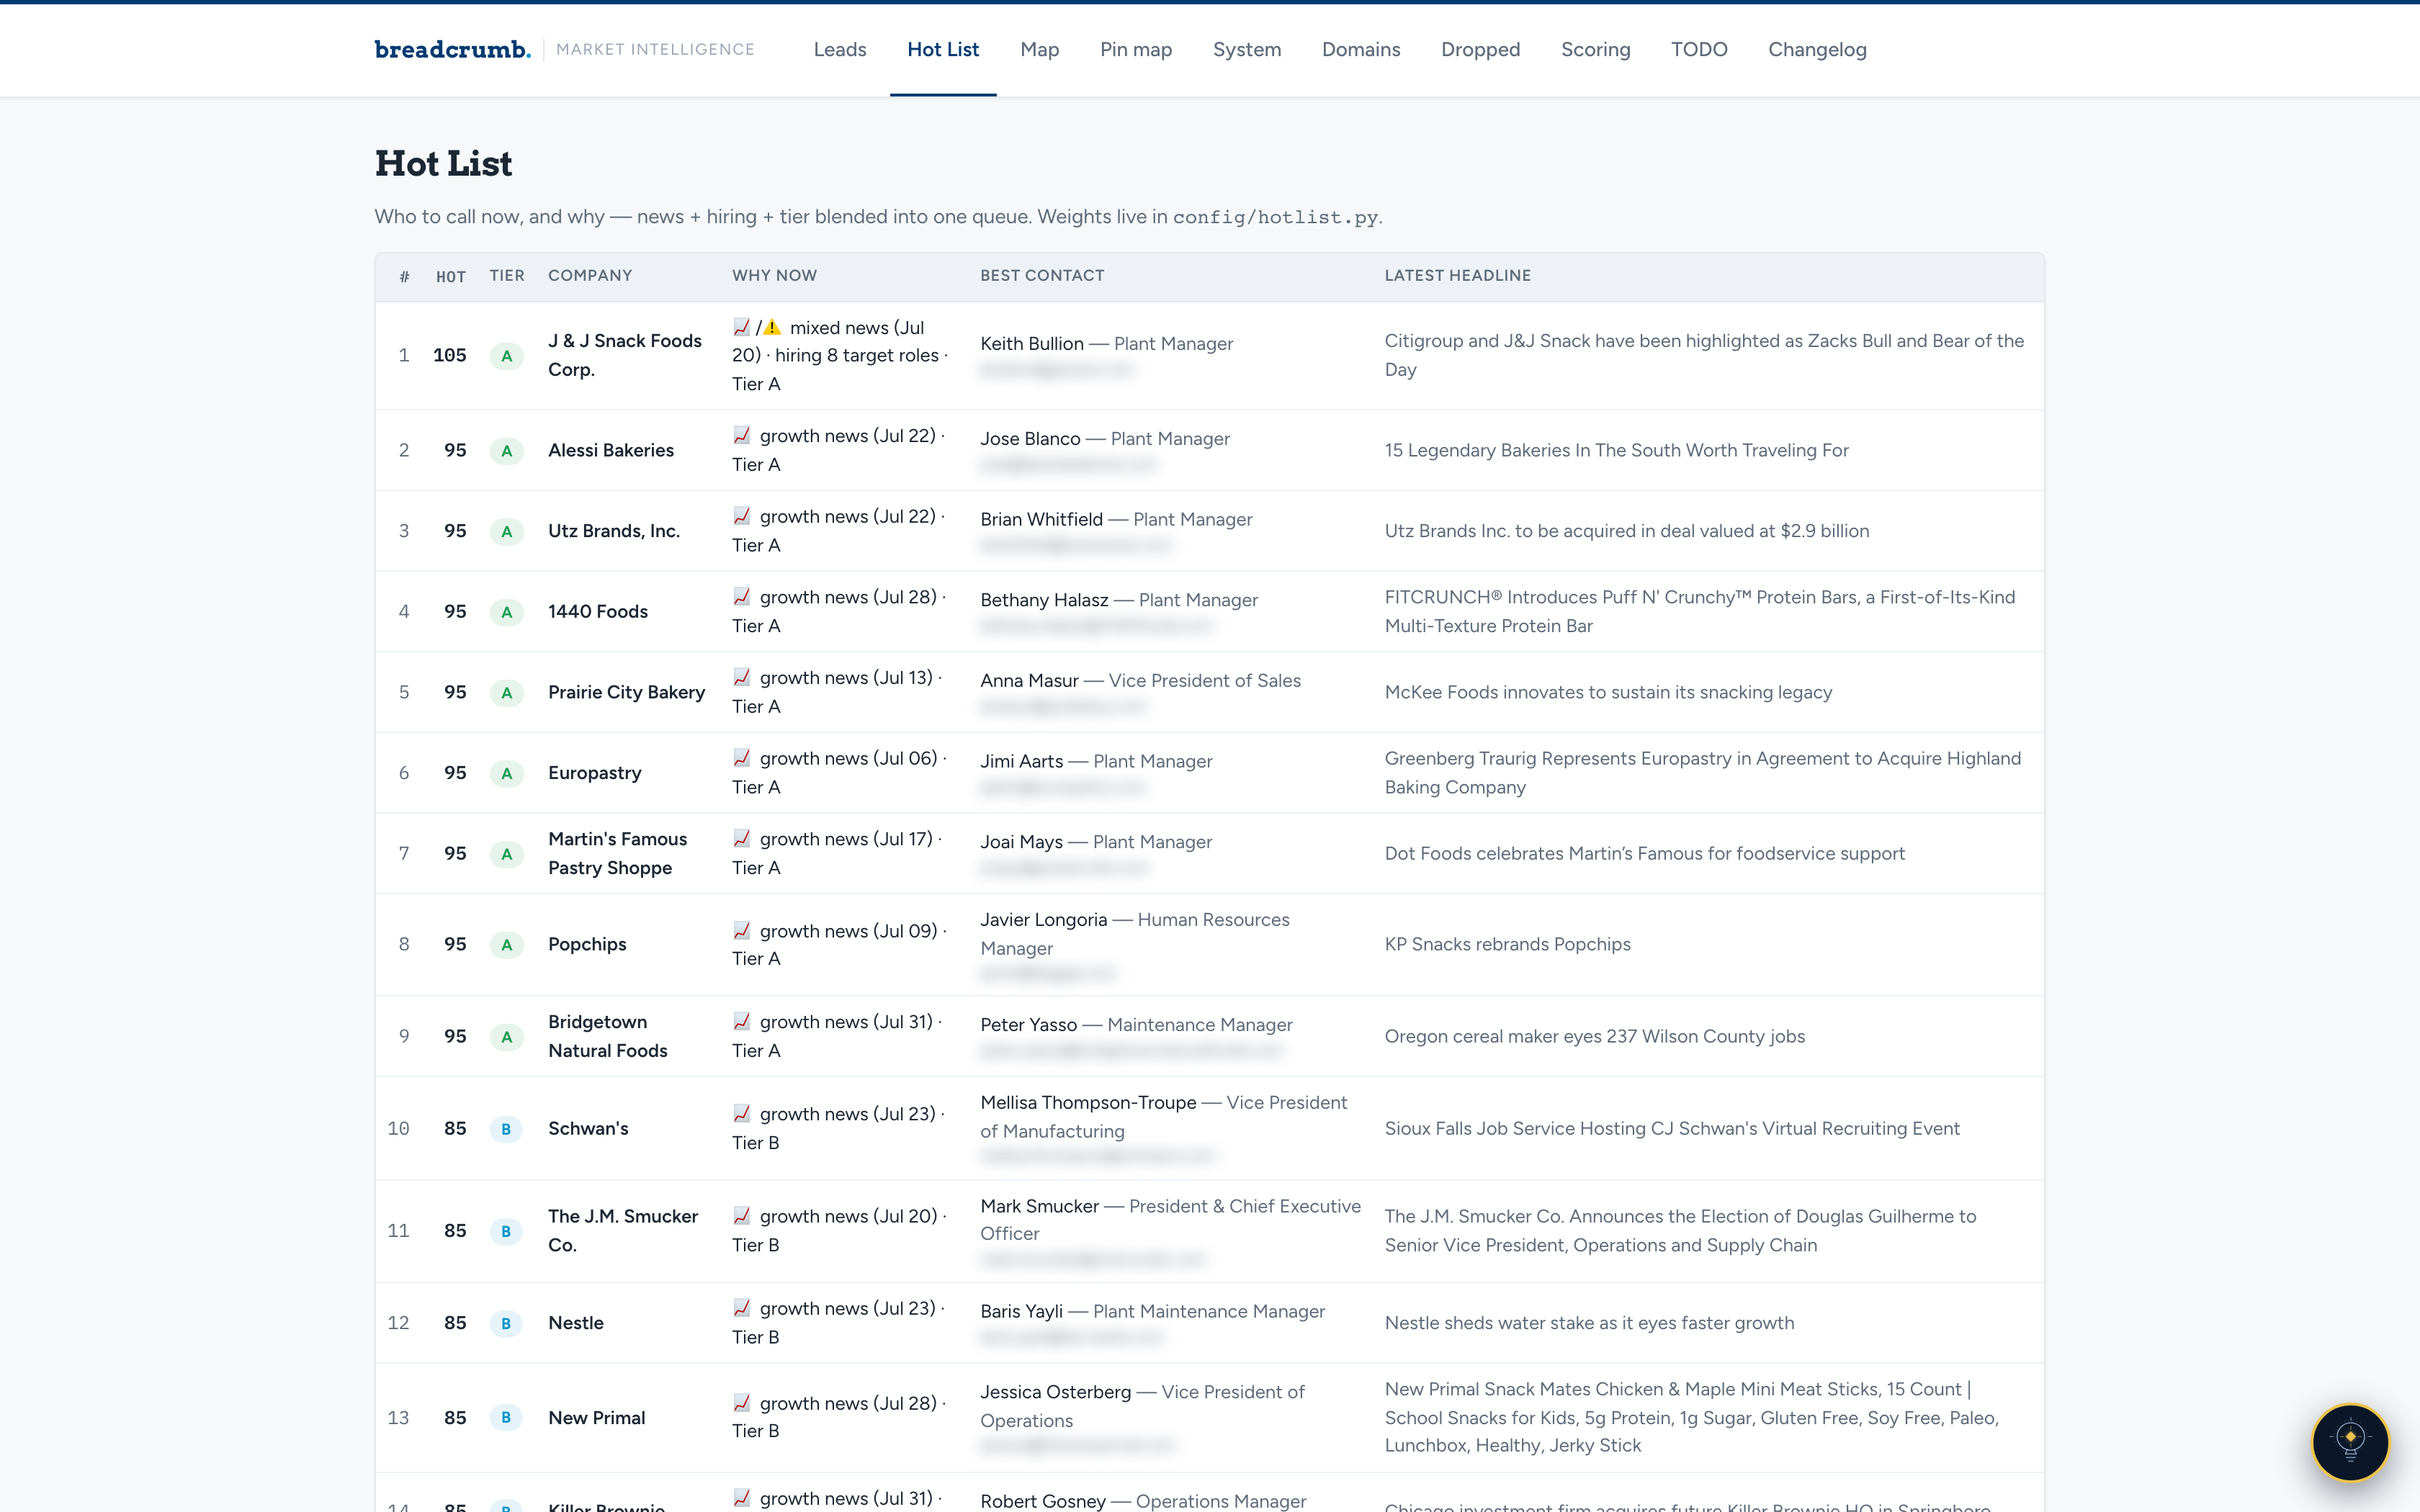
Market intelligence that stops at a spreadsheet still leaves your team doing the hard part by hand. The platform ships with a private lead management portal designed around one question: who do we call today, and why?
- The Hot List — news, hiring activity, and tier blended into a single ranked call queue, each row showing the reason to call now, the best contact, and the latest headline.
- Deal tracking — leads move through pipeline stages with events, notes, and AI-suggested next steps.
- Territories and saved views — reps see their region, managers see the whole board.
- Drafted outreach — first-touch emails drafted from the company's own profile and signals, ready to edit and send.
- Tasks, snoozes, and reviews — working-state tools so a 19,000-company dataset behaves like a tidy queue, not a firehose.
- Exports — clean CSVs whenever the data needs to travel to your CRM or a campaign.
And It Never Goes Stale
A list is a snapshot; this is a feed. Recurring jobs sweep company news and classify it as growth or risk, scan hiring for the roles that signal investment, probe every company website for the dead domains that fingerprint rebrands and acquisitions, merge duplicates that creep in across sources, and re-score the entire market — so the ranking your team works from reflects the market as it is today, not the day the project shipped. The thinking behind these signals is covered in mining buying signals from public data and entity resolution for scraped company data.
Any Industry. Any Vertical.
Nothing in the machinery is industry-specific. Adapting the platform means swapping three layers — the sources that define your market, the ideal customer profile the scoring measures against, and the fit logic the AI applies. Everything else carries over.
Equipment & Industrial Suppliers
Map every manufacturer that could house your machines — plant by plant, with facility size as a budget proxy. This is the vertical the first deployment mapped, for the commercial baking industry.
Packaging & Ingredients
Find every producer in a category, score by production scale and product mix, and watch hiring for the expansions that mean new demand.
Logistics & Warehouse Services
Map distribution centers and fulfillment operations by footprint and location — then rank by proximity to your lanes or coverage.
Medical & Dental Suppliers
Build the complete universe of practices, labs, or clinics in your specialty, tiered by size and fit, with owners and office managers identified.
Construction & Building Materials
Track contractors, developers, and fabricators by region and project signals — permits, hires, and announcements feeding the score.
Private Equity & M&A
Source acquisition targets with corporate family trees already untangled — who owns what, at what scale, with what momentum.
How an Engagement Works
Every build starts with your ideal customer profile: who buys, what a great account looks like, which roles sign, and where the market's edges are. From there ThinkGenius identifies the sources that see your industry, builds the discovery and enrichment pipeline, tunes the scoring model with your team until the tiers match your instincts, and delivers the portal your reps log into every morning. The underlying craft — production-grade data collection and AI deep search with cited sources — is the same machinery documented across this site.
The result isn't a report or a list. It's an asset: a private, continuously-updated map of your entire market that gets better every week — and that your competitors can't buy.
FAQs
What is a custom market intelligence platform?
A custom market intelligence platform is a private software system built around one company's target market. It continuously scours the public web — industry directories, trade publications, map data, registries, news, and job postings — to discover every company in a vertical, deduplicates them into one clean database, enriches each with an AI-researched profile, maps their plants and locations, finds decision-maker contacts, and scores every company against that one client's ideal customer profile. Unlike a purchased list or a shared sales database, the platform serves one client alone — the data, the scoring logic, and the portal are built around that client's market and nobody else's.
How does Tier A–D lead scoring work?
Every company receives a 0–100 score built from weighted dimensions: product or service fit, company size, facility scale, contactability, momentum signals like hiring and growth news, geography, and data confidence. The score maps to a tier — Tier A companies are ideal-fit and sales-ready with verified decision-maker contacts, Tier B are strong fits that need contact work, Tier C are possible or smaller fits, and Tier D is the tracked pool being watched for signals. Tier thresholds and weights are customized per client, every score keeps an audit history, and re-scoring runs on demand as new data arrives.
Can this work for my industry or vertical?
Yes. The machinery — multi-source discovery, deduplication, AI enrichment with cited sources, facility mapping, contact discovery, scoring, and lead management — is industry-agnostic. Adapting it to a new vertical means swapping three layers: the data sources that define the market, the ideal customer profile the scoring model measures against, and the fit logic the AI applies when it reads each company. The first deployment mapped the commercial baking industry; the same architecture maps any definable market.
What does an AI-built company profile include?
Each profile is a structured dossier: what the company makes, estimated revenue and headcount, number of plants, parent company and corporate family (sister companies, brands, former names, acquisitions), every facility with its location and estimated square footage, product-fit analysis mapping your offering to their operations, buying signals, recent news, hiring activity, and decision-maker contacts. Every claim stores the source URLs it was drawn from, so any fact can be audited in seconds.
How do you keep AI-generated data accurate and prevent hallucinations?
Every AI research pass is grounded in real pages the system fetched — the company's own website, public filings and registries, and established trade publications — and every claim stores the exact source URLs it was drawn from. Facts are corroborated across independent publishers, a separate verification pass re-checks that cited sources actually support each claim, contradiction audits flag conflicts between sources for human review, and anything that can't be supported by a source is dropped rather than published. AI provides the speed; citations, cross-referencing, and human review provide the trust.
How does the platform break down corporate structures?
An AI research pass maps every entity connected to a company — parent corporations, sister companies, operating subsidiaries, brands, historic names, and acquisitions — into a single family tree, with cited evidence behind each relationship. Entities already tracked as leads show their tier right in the tree, and relatives not yet in the system can be added and researched in one click. This matters because B2B buyers often hide behind holding groups and brand names: mapping the family reveals the full opportunity behind one company, and keeps duplicates from fragmenting the data.
How are decision-makers found and verified?
Contact discovery targets the roles that match your sales motion — plant managers, operations VPs, engineering directors, owners — and runs only against companies that score into your qualified tiers, so effort lands where it pays. Emails are verified before they reach your team, contacts carry title, seniority, department, and LinkedIn data where available, and companies that already have contacts on file are skipped automatically.
How is this different from buying access to a sales database?
Shared sales databases cover every industry shallowly and treat every subscriber the same; your competitors work from the very same rows, scored by someone else's logic. A custom platform covers one market exhaustively and privately — including small and mid-size companies that big databases miss, facility-level detail they don't collect, and a scoring model that encodes your definition of a great customer. And it keeps itself fresh with news, hiring, and data-health sweeps instead of decaying like a static export.
// Let's Build
Who Do You Sell To?
Tell me your industry and what a great customer looks like. I'll scope a platform that finds every one of them, scores them against your criteria, and hands your team a ranked call queue.